Vitamin A is important for the overall development and maintenance of the body. Our body does not produce vitamin A on its own. It needs to be supplemented through diet; that's why it's called an essential vitamin.
The retina is the film screen, located at the very back of the eye. It contains two important cells that process the light entering our eyes.
The rod cells help us see in low light, while the cone cells help our color vision. The rod cells contain an important protein called rhodopsin, which moderates low light vision. A form of vitamin A called the retinal helps activate rhodopsin.
This is why a severe deficiency of vitamin A can cause night blindness.
Vitamin A is also crucial for maintaining skin integrity and forming new skin cells. Since vitamin A is an excellent antioxidant, including it in your diet every day can lower your risk for heart attack.
We all know that carrots are a good source of vitamin A. They are a rich source of a molecule called beta-carotene. Beta-carotene is a provitamin A. Provitamins are substances that are converted into active vitamins in the body.
Beta-carotene is what is responsible for the bright orange color of the carrot. All plants provide vitamin A in the form of beta-carotene, among other forms.
Vitamin A is present as retinol, a form of active vitamin A, in animal food sources. Now, the beta-carotene from plant sources must be converted to active vitamin A for it to be useful to the body.
Let’s see how that happens.
The structure of beta carotene resembles that of a dumbbell - two ring-like structures joined by a chain. This chain is cut in a particular way to give rise to two molecules of retinol, or active vitamin A. This cleavage happens in the liver.
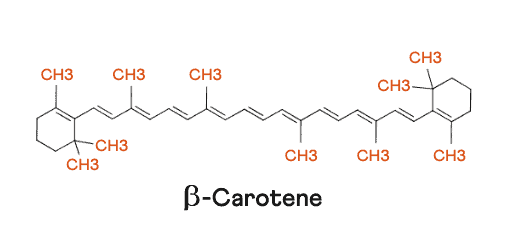
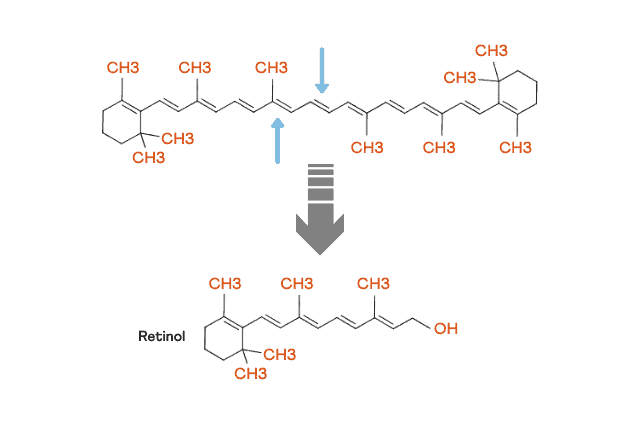
Image: Cleavage of beta-carotene to retinol
Vitamin A in the body can be converted or interconverted into different formats. The retinol and retinal forms are interchangeable, while there’s only a one-way conversion from retinal to retinoic acid.
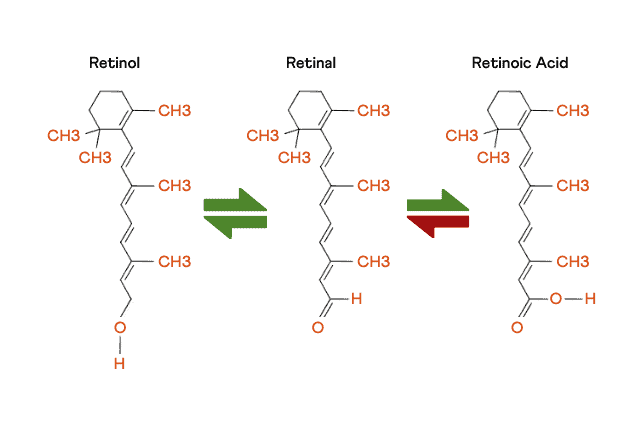
Image: Different forms of active vitamin A
The retinal form of vitamin A is absorbed by the intestinal villi along with fats. From there, it is transported to and stored in the liver. Whenever there's a requirement for vitamin A, retinal is released by the liver. It then binds to the specific retinol-binding protein, which serves as a carrier to transport it to various locations of the body.
The cleavage or the cutting of beta-carotene to form retinol is carried out by an enzyme called Beta Carotene Oxygenase or Monooxygenase. This enzyme is produced by the gene called BCMO1 or BCO1.
Every person has two copies of the BCMO1 gene. But, about 45 percent of the population carries at least one change or variation in the gene that reduces the enzyme activity. This results in a significantly impaired ability to convert beta-carotene into retinal.
Depending on which combination of variants someone has, beta-carotene conversion can be nearly 70 percent lower than its normal efficiency.
Vitamin A deficiency has serious health implications.
Knowing your BCMO1 gene status can help you gauge your genetic risk for vitamin A deficiency. This can be done through a genetic test.
Most genetic tests provide your DNA information in the form of a text file called the raw DNA data. This data may seem like Greek and Latin to you.
At Xcode Life, can help you interpret this data. All you have to do is upload your raw data and order a nutrition report. Xcode Life then analyzes your raw data in detail to provide you with comprehensive nutrition analysis, including information on your vitamin A requirements.
Excess sugar in the body or hyperglycemia is a prevalent condition affecting almost 3.5 million people in the US (according to a 2017 report). The Van Andel Research Institute study reports how an excess intake of dietary carbohydrates can damage mitochondrial integrity and, thereby, function.
According to the CDC, in 2017-18, the dietary sugar intake of Americans was 17 teaspoons. However, the American Heart Association (AHA) only recommends six teaspoons per day. Sugar is broken down (metabolized) in the body to glucose.
Now, the regulation of glucose levels in the body is closely controlled. Any imbalance in the glucose level leads to metabolic disorders, most commonly, diabetes.
Hyperglycemia occurs when the blood glucose concentration rises above 140 mg/dl (7.8 mmol/l).
Excess glucose levels can lead to insulin resistance, where the cells in your muscles, fat, and liver do not respond to insulin. When this happens, the blood glucose levels begin to rise. Persistent insulin resistance ultimately leads to type 2 diabetes.
A mitochondrion is an organelle in the body and is popularly known as the powerhouse of the cell. Mitochondria (plural) are the centers where energy production occurs. They supply energy to all cells and the whole body.
Adipose tissues are the primary controller of whole-body energy regulation. They store excess energy (in the form of triglycerides) and dissolve the same to provide power to the body in the event of energy scarcity.
There are two types of adipose tissues: brown adipose tissue and white adipose tissue.
WAT is responsible for storing excess energy, and BAT expends energy at times of energy scarcity. Beige adipocytes (adipose or fat cells) are at a basic level WAT cells. But, at times of extreme duress, beige adipose cells act as BAT and provide the body with extra energy.

Reportedly, mitochondrial malfunction in adipose cells contributes to metabolic disorders, predominantly obesity, and type 2 diabetes. Thus, one of the main causative factors of metabolic disorders is defective cell metabolism - which purportedly is caused by flawed energy production and distribution.
Additionally, a mitochondrial malfunction has adverse effects on the body.
Scientists at the Van Andel Research Institute explored the effects of excess sugar intake on mitochondrial integrity and function.
Scientists used a genetically altered mice model to allow the cells to accept excess sugar intake. Mitochondrial function was then measured using BAT thermogenesis (the process of heat production by brown adipose tissue).
The following were observed in the study:
PUFA or polyunsaturated fatty acids are important for supporting mitochondrial functioning and other biological processes like inflammation, cell to cell communication, and blood pressure regulation.
Saturated fatty acids are what are popularly known as bad fats. This fatty acid isn't nearly as useful or flexible as the PUFA. This disturbs the lipid composition of the mitochondrial membrane, thereby damaging the mitochondrial integrity.
Restoring normal glucose levels resulted in the balance of the fatty acid levels. This restored the lipid composition as well as the mitochondrial integrity and function.
The study found that the cellular changes brought on by a sugar-rich diet may go undetected or may not manifest under normal conditions; upon introduction of cellular stress (changes in cells that are inflicted by environmental stresses like extreme temperatures, exposure to toxins, etc.), these changes may become evident as functional deficiencies.
In conclusion, excess sugar intake throws off the lipid balance in the body. If the balance is not restored for a while, it can damage our mitochondria, making us more prone to an array of metabolic disorders like type 2 diabetes.
Menarche marks the beginning of the first menstrual cycle. This is a significant event of puberty and helps the body prepare for reproduction. According to the National Health Statistics Report, the mean age of menarche in the United States between 2013 and 2017 was 12.5. Globally, the mean age of menarche is about 13.
Menarche marks the beginning of the production of female reproductive hormones. These hormones circulate in the body until menopause. During the reproductive years of a woman (the period between menarche and menopause), the levels of the two steroid hormones, estrogen and progesterone, keep fluctuating.
The progesterone levels increase during the luteal phase. It is the highest during the mid-luteal phase and decreases when periods start. Progesterone is responsible for thickening the endometrium walls and preparing the body for a possible pregnancy. The estrogen levels increase twice during each menstrual cycle - once during the mid-follicular phase and once during the mid-luteal phase.
The follicular phase is the phase between the first day of menstruation and the next ovulation day. It lasts between 14 and 16 days. The luteal phase is the phase after ovulation until the next menstrual cycle. This lasts for 11-17 days.
The lifetime cumulative number of menstrual cycles is a term that denotes the total number of menstrual cycles a woman experiences in her lifetime. With increased menstrual cycles, the woman’s exposure to estrogen and progesterone also increases. These hormones circulate the breast tissues and increase the risk of developing breast cancer.
Therefore, the number of menstrual cycles a woman has is a risk factor for developing breast cancer.
Studies show that women who have regular and shorter menstrual cycles have a higher risk for breast cancer than those with longer cycles.
These studies also report that women who had more menstrual cycles before their first full-term pregnancy were at higher risk for breast cancer.
A population-based study analyzed the relationship between the number of menstrual cycles a group of 6718 women had before menopause and their risk of breast cancer. The study reports that women who had more menstrual cycles and hence more exposure to estrogen were at higher risk for breast cancer.
With early menarche, women have increased exposure to estrogen and progesterone. For instance, assuming the menopausal age to be 50, a woman with a menarche age of 11 has a 39-year exposure to the hormones. On the other hand, another woman with a menarche age of 17 only has a 33-year exposure to the hormones.
A study analyzed serum estrone (E1) and estradiol (E2) levels in postmenopausal women. The study shows that women with a late menarche age (later than 17 years) had significantly lesser amounts of E1 and E2 levels after menopause. This brought down their risk of breast cancer.
A meta-analysis studied the relationship between menarche age and risk of breast cancer in 118,964 women with a breast cancer diagnosis across 117 studies. According to the meta-analysis, breast cancer risk increases slightly for each year earlier menstruation begins (by about 5%).
Another study reported that women with a menarche age of 11 or lower had a 15-20% higher chance of developing breast cancer than women with a menarche age of 15 or higher.
Changes in the functioning of specific genes (genetic polymorphisms) can increase or decrease the menarche age and, as a result, increase or decrease the risk of breast cancer.
The INHBA gene (Inhibin, beta A gene) helps produce the INHBA protein. This protein plays a role in controlling the production of the Follicle-Stimulating Hormone (FSH). FSH increases and decreases during each menstrual cycle and plays a role in the maturation of the reproductive system.
rs1079866 is a single nucleotide polymorphism or SNP in the INHBA gene. It has been associated with breast cancer risk. The C allele of this SNP has been associated with lower age of menarche and increased risk of breast cancer.
In women with a lower menarche age, the SNP rs1079866 of this gene showed an increased risk of developing breast cancer. People with this SNP had a per-risk-allele odds ratio of 1.14.
The PXMP3 gene helps produce the PXMP3 protein (peroxisomal membrane protein 3). The A allele of the SNP rs7821178 is associated with a higher risk of breast cancer in women with early menarche ages.
The LEP gene helps produce a hormone called leptin. Leptin is responsible for maintaining body weight and controlling fat stores. Leptin also plays a role in fertility and the initiation of puberty.
People with the AA genotype of the SNP rs7799039 of this gene have early menarche and an increased risk of breast cancer.
Studies show an inverse relationship between Body Mass Index (BMI) levels and menarche age. Younger girls who fall under the overweight and obese categories get their first menstrual cycle very early. This can increase the risk of breast cancer in girls as they grow up. Maintaining healthy BMI levels from a very young age can help women lower breast cancer risk.
Girls who were physically active as they grew up have significantly delayed menarcheal age compared to girls who did not have much physical activity. A Canadian study reports that girls who participated in dance, swimming, figure skating, and diving competitions had a lower risk of reaching early menarcheal age. Adequate physical activity will help bring down the risk of breast cancer as the girls grow up.
A 2004 study analyzed the effects of tobacco smoke exposure in little girls and their menarcheal age. According to the study, girls who had high exposure to prenatal smoke and secondhand smoke had early menarche compared to girls who were not exposed to tobacco smoke.
Early menarche age and the inhalation of carcinogenic chemicals from tobacco smoke can both increase the girl’s risk of breast cancer when she grows up.
A small-scale study analyzed the effects of nutrition on menarche age. According to the study, girls who consumed more animal proteins than plant proteins between the ages of 3 and 5 had earlier menarche.
Another study reported that girls who consume isoflavones, a type of isoflavonoid (plant compound) produced by the bean family, experience slightly delayed menarche. Soybeans, chickpeas, peanuts, and pistachios are rich in isoflavones.
According to the 2019 National Survey on Drug Use and Health (NSDUH) report, 85.6% of people in the United States who are 18 or older have consumed alcohol at some point.
51% of women reported that they consumed alcohol in the past month.
While alcohol consumption causes many health problems, it is also a risk factor for breast cancer.
Breast cancer is the most common cancer affecting millions of women globally.
In the United States, 1 in every eight women will develop invasive breast cancer in her lifetime.
Once alcohol enters the body, it is metabolized and cleared through a detoxification pathway.
An important enzyme involved in this process is alcohol dehydrogenase (ADH).
ADH converts ethanol to AA. AA is carcinogenic (cancer-causing) and needs to be quickly eliminated from the body.
While ADH is primarily expressed in the liver, it is also found in small quantities in the breast tissue.
ADH converts ethanol into AA in the breast tissues and causes abnormal DNA changes, leading to breast cancer.
Alcohol can increase estrogen levels in the body.
A study reported that when compared to women who don’t drink, pre-menopausal women who drink have an 18% increase in serum estrogen levels.
The body uses CYP enzymes to clear out excess estrogen from the body.
These enzymes convert estrogen into intermediaries that are then removed from the body.
This conversion process releases free radicals that can cause cell DNA abnormalities and increase the risk of cancers, including breast cancer.
Higher estrogen levels in the body can also increase the activity of the Estrogen Receptor α (ERα) protein.
This protein attaches itself to the DNA and controls various genes.
Increased ERα activity leads to increased cell division and growth (cell proliferation), increasing the chance of cell damage and resultant cancer.
Breast density or mammographic density measures the type of tissues that make up the breasts.
Breasts contain fat tissues, glandular tissues (tissues that help make breast milk), and connective tissues.
People with high glandular and connective tissues in the breast and less fatty tissues have high breast density.
On the contrary, people with high levels of fat tissues, when compared to glandular and connective tissues, have low breast density.
According to a meta-analysis that looked into more than 42 studies, women with more than 75% breast density had up to 5 times higher risk for developing breast cancer than women with less than 5% breast density.
On mammograms (X-rays to examine human breasts), fatty tissues look dark, and connective and glandular tissues look clear or white.
Cancer cells also appear white. As a result, cancer cells may be hidden on mammograms until they have grown or spread in people with higher breast density.
This makes breast cancer treatments more complicated.
A study interviewed 262 women in New York and analyzed their mammograms and alcohol intake pattern.
According to the study, women who drank at least seven drinks a week had a 12.3% higher breast density than women who don’t drink.
Another 2015 study analyzed the relationship between drinking patterns and breast density in 189 women.
This study also reported that women who drank more than seven drinks a week had higher breast density than those who did not drink.
The ALDH2 gene helps produce the Aldehyde dehydrogenase (ALDH) enzyme.
Changes in the ALDH2 gene can lead to problems producing the ALDH enzyme that helps clear alcohol from the body.
According to studies, people with the AA and GA genotypes of the Single Nucleotide Polymorphism (SNP) rs671 of this gene have a higher risk of developing breast cancer when they consume alcohol than people with the GG genotype.
| Genotype | Implication |
| AA | Increased risk of breast cancer on alcohol consumption |
| GA | Increased risk of breast cancer on alcohol consumption |
| GG | Normal risk of breast cancer on alcohol consumption |
The CYP2E1 gene helps produce the CYP2E1 enzyme. This enzyme helps in clearing up to 20% of ethanol in the brain.
According to a Korean study, women who had the CYP2E1 c2 allele and drank at least once a month had a 1.9-fold increased risk for developing breast cancer than non-drinking women with the CYP2E1 c1/c1 genotype.
The GSR gene (Glutathione-Disulfide Reductase gene) helps produce the GSR enzyme.
This enzyme helps in preventing oxidative stress and cell damage in the body.
The SNP rs1002149 in this gene is associated with breast cancer risk on alcohol intake.
The T-carriers of this SNP showed a 24% higher risk of developing breast cancer when they consumed more than 10 grams of alcohol a day.
The GG carriers did not show such a risk.
| Genotype | Implications |
| GG | No risk of breast cancer because of alcohol consumption |
| GT | Increased risk of breast cancer on consuming more than 10g alcohol/day |
| TT | Increased risk of breast cancer on consuming more than 10g alcohol/day |
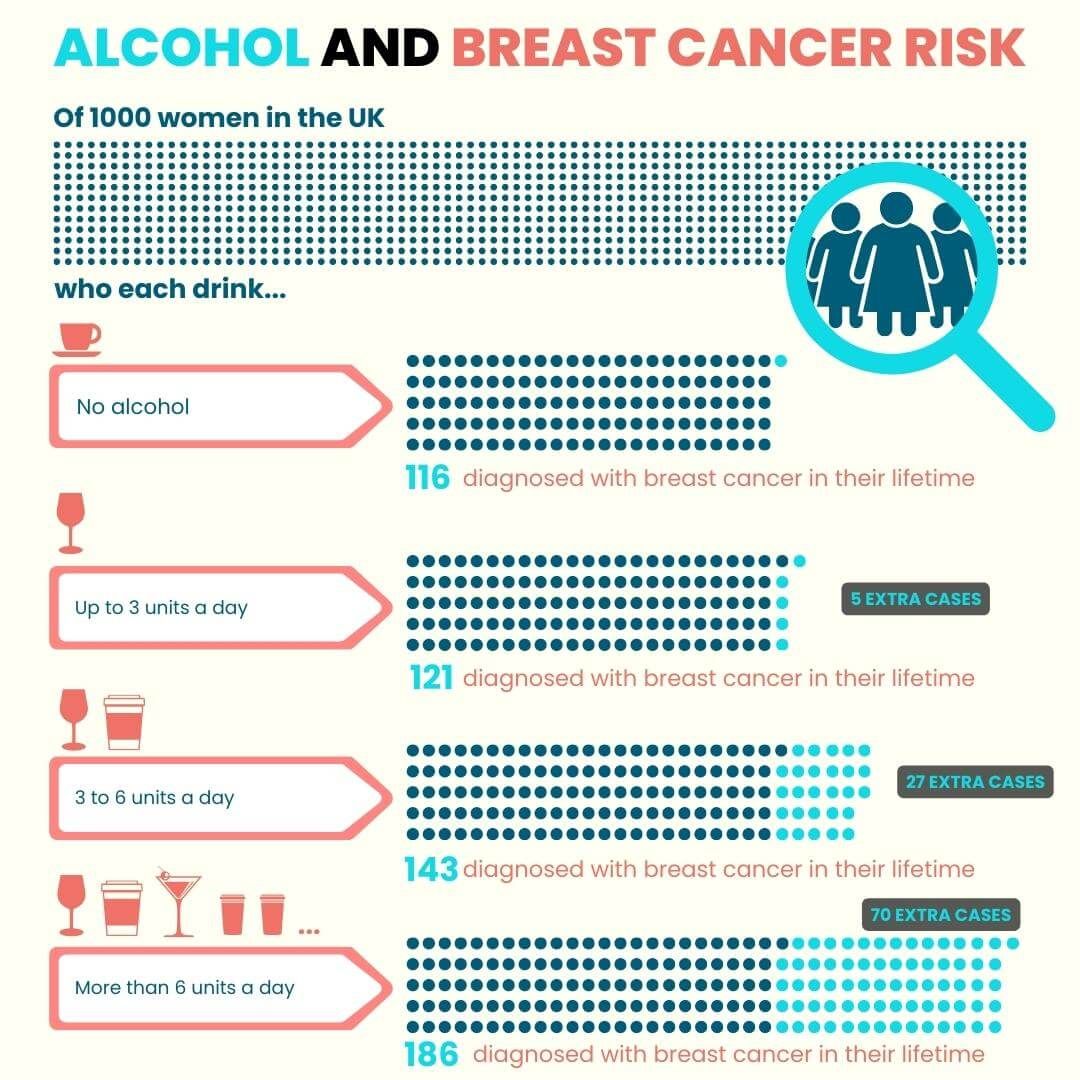
The risk of breast cancer increases with an increase in alcohol consumption.
A meta-analysis of 53 studies reported the following.
The study also suggested that the risk of breast cancer increased by 7% for every additional drink the woman had per day.
It is not enough to calculate the number of drinks to analyze the risk for breast cancer.
The drinking patterns should also be taken into account.
Drinking multiple alcoholic beverages in the same sitting is considered riskier than consuming moderate quantities over the week.
For instance, a woman who drinks seven over the weekend and refrains from drinking on weekdays is at higher risk for breast cancer than a woman who drinks one a day.
Studies show that early-life exposure to environmental carcinogens increases a woman’s risk of developing cancer.
The age between menarche (the first menstrual cycle) and the first pregnancy is considered a high-risk period.
Women who drink excessively or take up binge drinking at an early age are more affected by alcohol during this period and are at a higher risk of being diagnosed with breast cancer.
Different types of alcohol have different levels of ethanol content in them.
This can increase or decrease the risk of developing breast cancer.
Also, certain alcoholic beverages like red wine have antioxidant properties that can protect against cancers to an extent.
A small study reported that resveratrol, a type of polyphenol (plant compound) found in red wine, can bring down estrogen production in the body and decrease the risk of developing breast cancer. Red wine also seems to help reduce breast density in young premenopausal women.
Another study talks about the chemoprotective effects of beer. Beer contains the pods of a coneflower called hop that gives the drink its bitterness and flavor.
Hops contain substances like xanthohumol and hop-bitter acids that may have cancer-preventing abilities.
Please Be Advised: Alcohol consumption of more than your daily dose can increase your risk of accident, injury or hangover.
Some people just cannot completely avoid drinking. Drinking in moderation may help in such cases. Taking one or lesser drinks per day can help bring down the risk of breast cancer.
When the body suddenly processes excess alcohol, it struggles and leads to excess production of acetaldehyde and estrogen.
Avoid binge drinking and split your alcohol dosage evenly throughout the week. According to the National Institute on Alcohol Abuse and Alcoholism, binge drinking in women equals consuming more than four drinks in 2 hours.
Early exposure to alcohol, especially between the periods of menarche to the first pregnancy, can cause irreparable damage to the breast cells.
Several studies have shown that breast cells are easily damaged/altered by environmental factors in the early periods.
In the United States, the minimum drinking age is 21.
However, reports show that 1 in 4 women aged between 12-20 has consumed an alcoholic beverage in the last month.
Women who started drinking before 25 years seem to be at a higher risk of developing breast cancer than those who started later.
Avoid consuming alcohol before 21 and limit the number of drinks you consume after the legal age.
Breast cancer results from several genetic and environmental factors, and alcohol consumption is just one of them.
Genetic testing will tell you if you are genetically at a higher risk for developing breast cancer. If so, you may want to control the environmental factors better.
If you belong to the high-risk category, getting a mammogram periodically helps too.
The common ingredient in your tea, coffee, and energy drinks, caffeine, is the strongest psychoactive drug in the world. It is not a secret that caffeine helps you stay awake. But, how does it manage to do that?
Let's first look at how your brain puts you to sleep.
Adenosine triphosphate, or ATP, is the energy currency of your body. ATP is broken down into a molecule called adenosine in the brain. Adenosine moves around the neurons keeping up your energy levels throughout the day.
As the day progresses, some of these adenosine molecules exit the neurons and bind to the receptors. This causes sleepiness. There are two adenosine receptors, A1 and A2A. A1 receptors are found on neurons that keep the brain awake, and A2A receptors are found on neurons that initiate sleep.
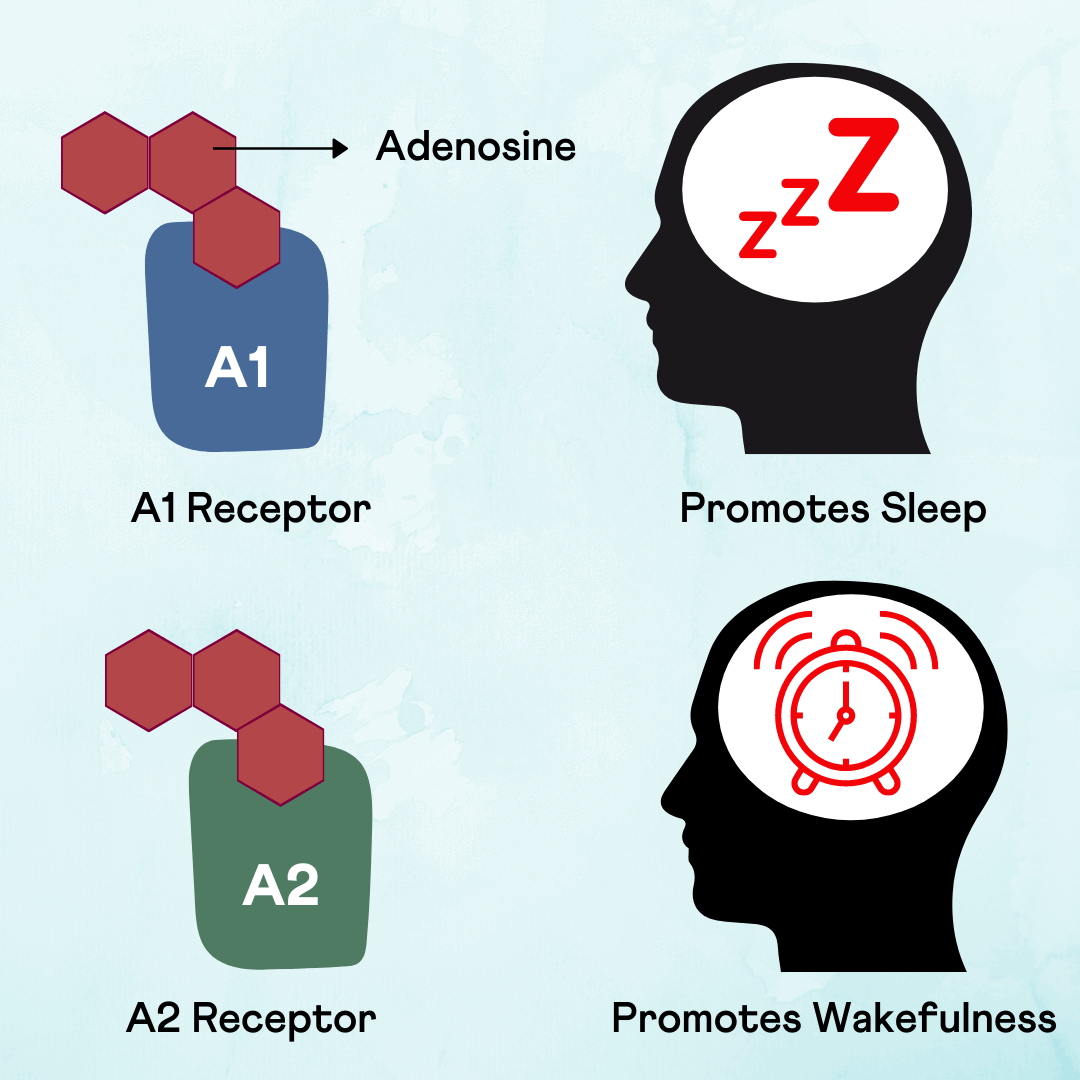
Image: Adenosine receptors and sleep
When adenosine binds to the A1 receptor, it reduces the activity of the neurons. When it binds to the A2A receptors, it increases the activity of the receptor. The combination of this binding, along with a few other hormonal changes, makes you sleepy. When you sleep, the adenosine is slowly released from the receptors, and when there isn't enough left to bind to the receptors, you wake up from a refreshed night of sleep.
Caffeine and adenosine are similar in structure. So, the caffeine can mimic the adenosine molecules and bind to the A1 and A2A receptors. However, caffeine's structure isn't identical to adenosine. As a result, it doesn't produce the "sleepy" effect.
Instead, it wards off sleepiness by preventing the adenosine molecules from binding and initiating the sleep process.
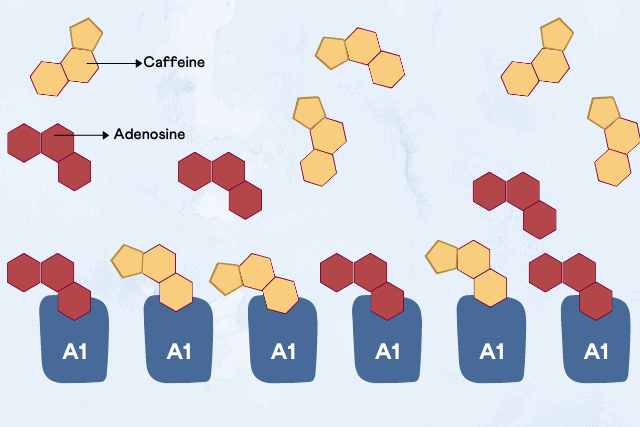
Image: Caffeine binding to adenosine receptors
But this effect lasts for only two to four hours, depending on how fast your body can break down the caffeine. This largely depends on your genes. When your body starts getting used to the caffeine intake, it produces more adenosine receptors to counteract the effect of caffeine. You may have to end up consuming more caffeine to stay awake!
Increased caffeine consumption leads to increased production of the receptor, which again results in increased caffeine consumption. It is a pretty vicious cycle that can make you a chronic caffeine drinker! As a result, you eventually develop caffeine tolerance. When you abruptly bid farewell to caffeine, you may end up feeling way too drowsy because of the additional adenosine receptors in the brain. This is called caffeine withdrawal.
Caffeine withdrawal is characterized by other symptoms like:
They can last up to a week till the number of receptors goes back to normal. Caffeine isn't as addicting or life-threatening compared to drugs like cocaine. People tend to have a mild physical dependence on this drug. People cannot overdose on caffeine easily. An average adult would have to have about 100 cups of coffee, which amounts to 10 grams of caffeine, to experience any lethal effects of caffeine.
The adenosine receptors are also found in the heart and kidneys. Activation of the receptors decreases the activity of these organs as well. Reduced urine output and heart rate prepare the body for a good night's sleep. However, when caffeine goes and binds instead, it results in increased heart rate and urine production. This is manifested as caffeine jitters and dehydration.
Caffeine isn't very dangerous; however, children should avoid it. Scientists haven't understood the effect of caffeine on a developing brain yet. It is also unhealthy for an adult to be consuming too much caffeine. Sleep and rest are essential for healthy brain function and well-being.
The genes that metabolize caffeine can say a lot about how much caffeine is "healthy" for you. A genetic test can help identify your caffeine metabolizing status.
Xcode Life's Gene Sleep report profiles genes that influence sleep upon caffeine consumption. All you need is your genetic ancestry test raw data to get started!
| Parameters | Athletigen | Xcode Life |
| Type of genetic testing | DNA Kit and DNA raw data analysis | DNA raw data analysis DNA Kits in select countries |
| Ancestry reports | Not offered | Offered in select countries |
| Health reports | Not offered | Offered |
| Pharmacogenomic reports | Not offered | Offered |
| Raw data upload | Only from 23andMe, and AncestryDNA | DNA raw data from all major providers accepted. Comprehensive list |
| Number of reports | 5 (with overlapping traits) | 10 |
| Report Updates | No | Quarterly |
| Price | $19.99-$174.99 | Reports: $30-$50 Bundles: $160-$199 Price details |
| Sample reports | Available as PDF | Available as detailed report walkthrough videos |
Athletigen is a sports genetic testing company founded by Jeremy Koenig in 2014. It is located in Halifax, Nova Scotia, a city in Canada.
It caters to individual athletes, professionals, as well as sequence owners.
They provide personalized DNA analysis and recommendations to boost your nutritional wellbeing, performance, and athletic ability.
The Athletigen team aims to help elite athletes boost their performance with the help of DNA analysis.
Athletigen has announced the temporary discontinuation of their DNA testing. The last day to access the account and reports is February 28, 2021.
Athletigen extends its services to:
This report contains information on how your genes influence the response of your body to certain nutrients in the diet.
It provides insights into 40 nutritional traits, including some vitamins, minerals, and macronutrients.
This report aims to optimize your training using DNA analysis. It provides insights into 40 traits related to physical fitness.
This report helps you identify the underlying genetic cause of certain health conditions. It provides information about your health risk to enable you to make necessary lifestyle changes to improve your overall health and wellbeing.
The athletic report includes 40 traits and analyzes over 75 genetic variants.
The following topics are covered in the report:
The following topics are covered in the report:
Endurance - Provides information on how genes influence our body's aerobic efficiency, which in turn decides our endurance ability.
Power vs. Endurance - Helps identify whether you are a better power responder (better at activities like sprinting) or an endurance responder (better at activities like marathon running)
Speed and Power - Provides insights into anthropometrics (measurements and proportions of the human body) and how it reflects in training efforts.
Other Training Influencers - Gives information on genes that influence factors like body temperature and caffeine sensitivity that could impact overall performance.
Injury Risks - Helps understand the role of genes in injury risks and provides training recommendations to prevent injuries.
Strength and Hypertrophy - Gives insights into how genes impact muscle strength (strength) & muscle growth (hypertrophy).
Exercise Recovery - Enables you to design an optimal recovery time according to your genetic makeup.
Sleep Hygiene - Provides information on genes that impact sleep quality & pattern, and thereby sports performance.
Endocrine System - Helps to learn about genes that impact the functioning of the endocrine system and hormone levels.
Sports Psychology - Helps to understand how genes influence mental performance.
Walkthrough of the report
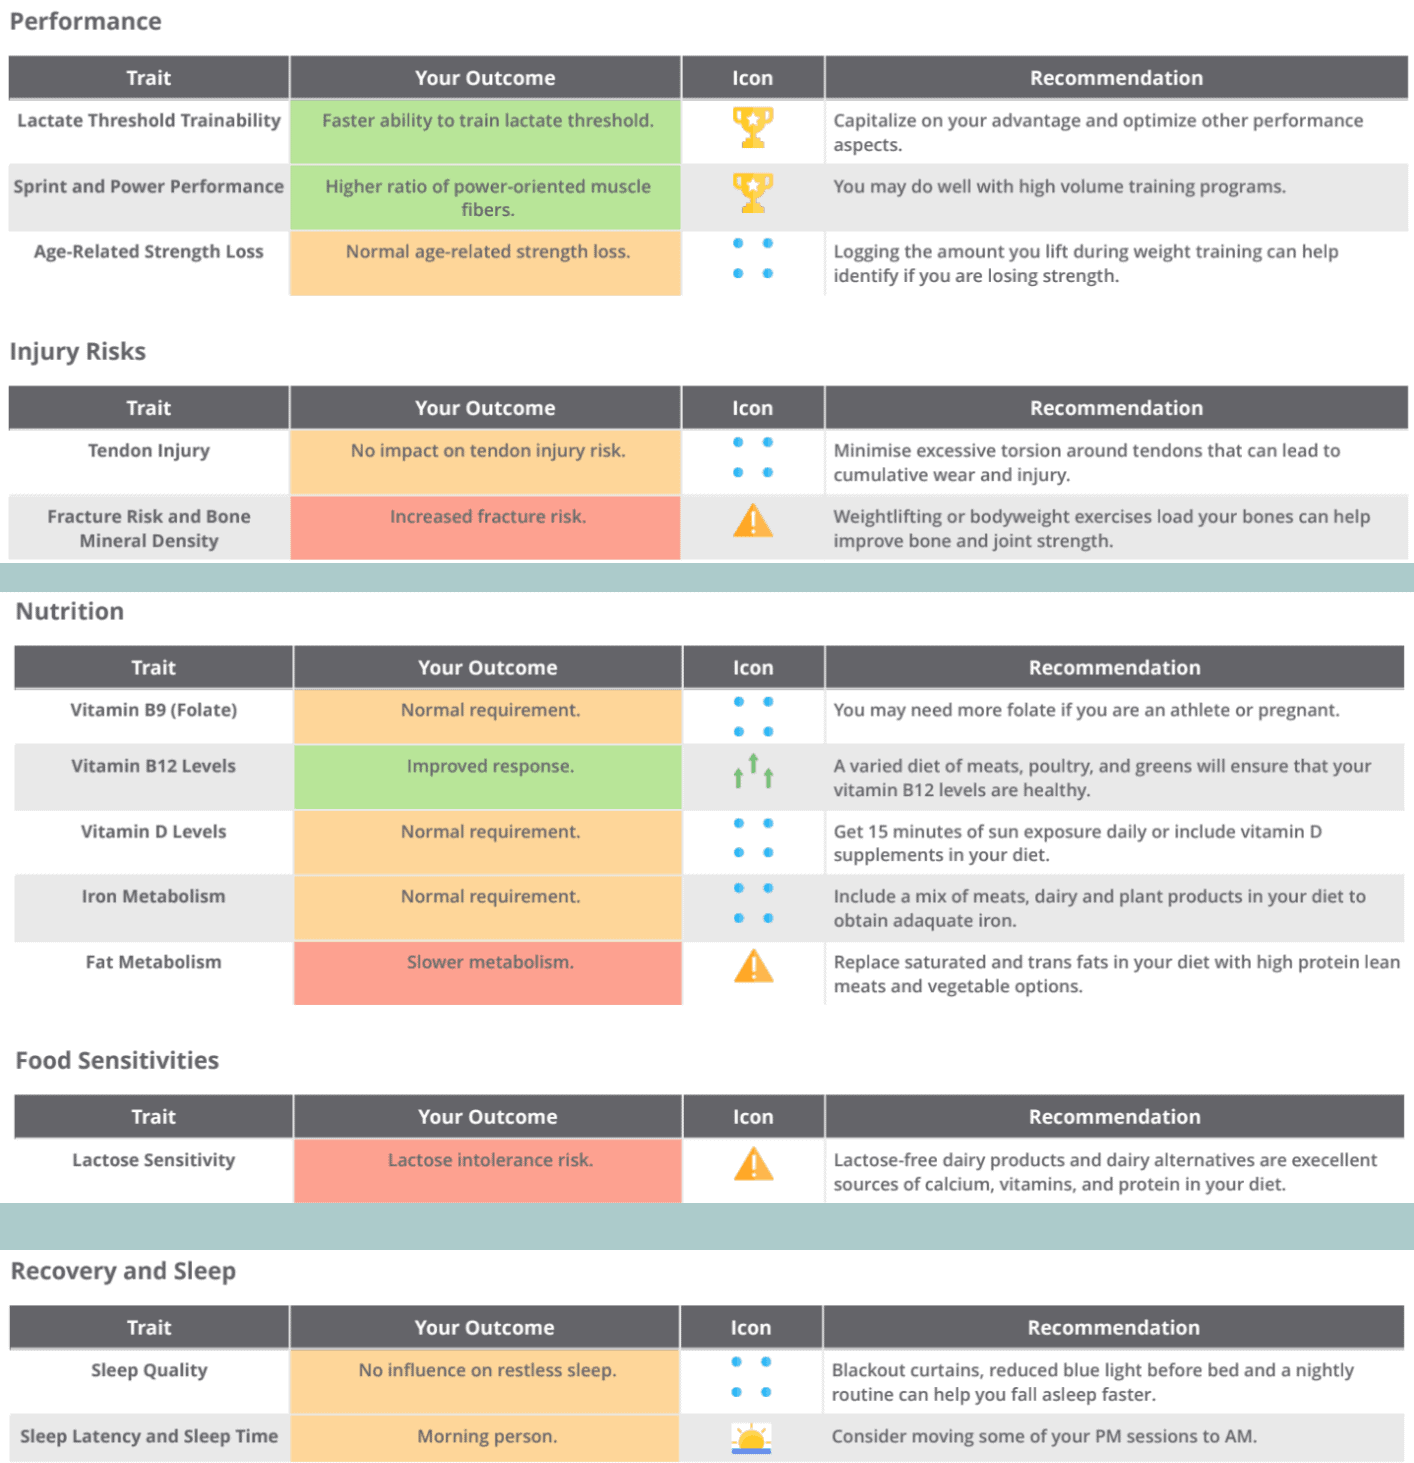
The report begins with the summary of your results tabulated under the section called "Overview of Your Report."
The table has the following information:
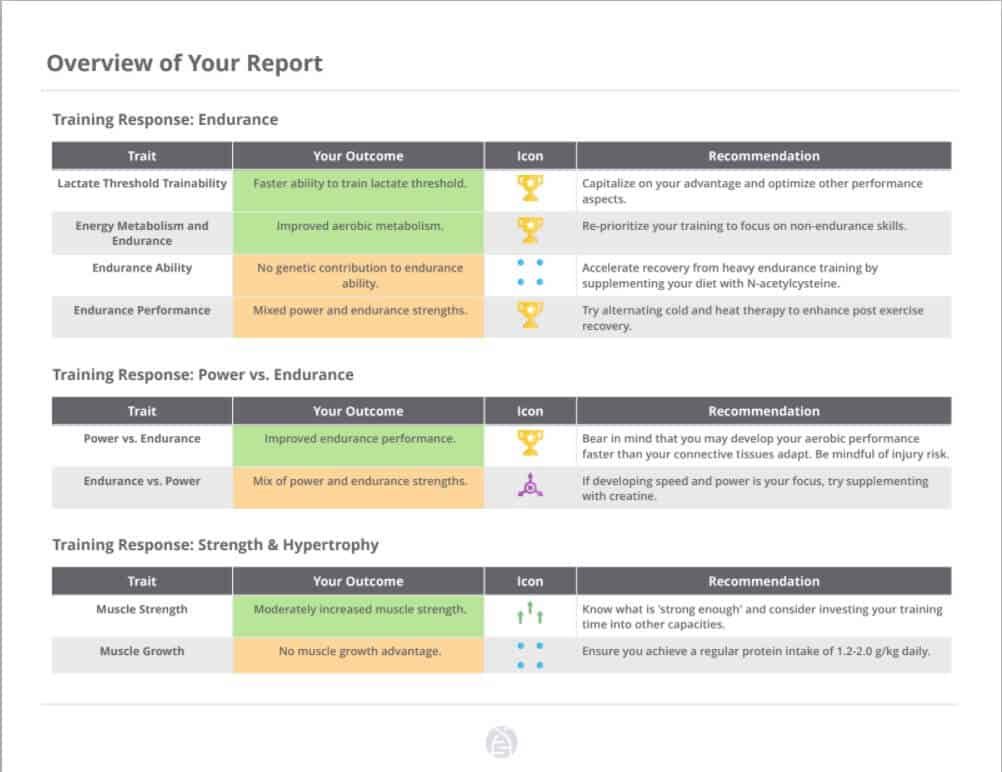
Each page contains detailed information on a specific fitness trait.
This report includes information on how your genes influence the absorption and metabolism of various vitamins and minerals. It analyzes 100 genetic markers and includes 30 traits. The following report topics are included:
Walkthrough of the Report
The report begins with the summary of your results tabulated under the section called "Overview of Your Report." It summarizes your outcomes for all the vitamins.
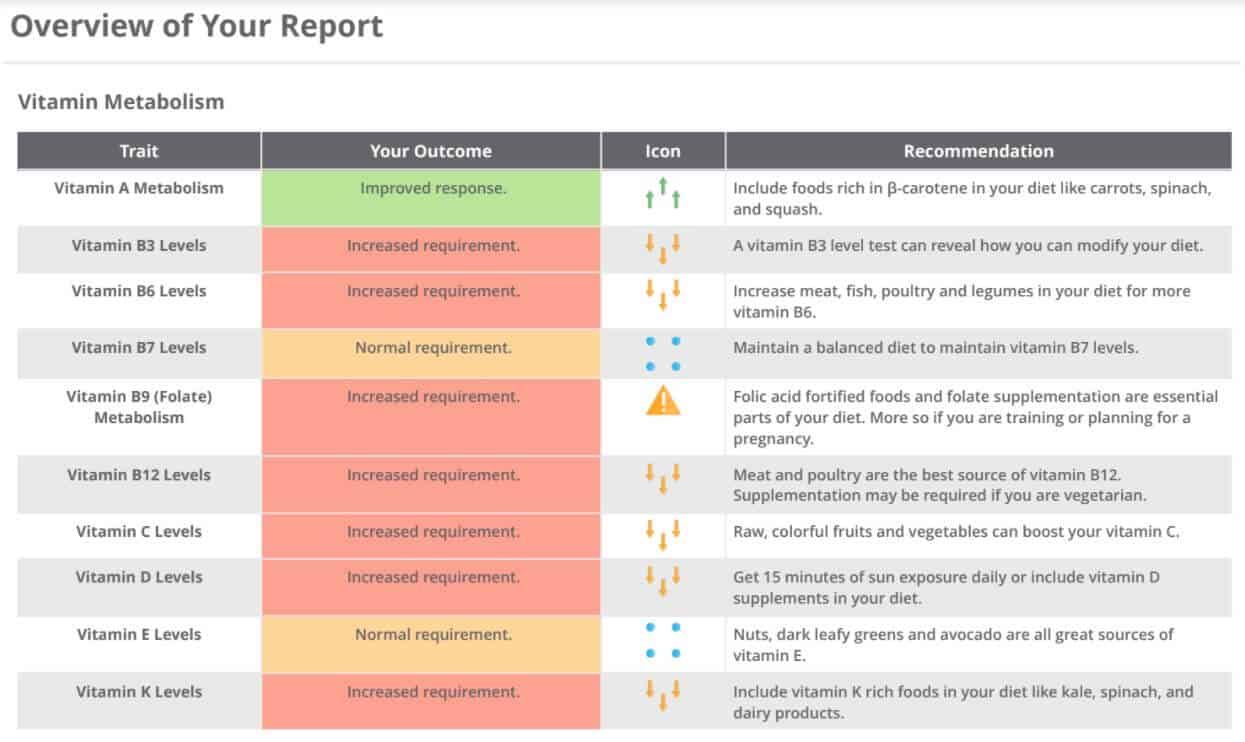
The table has the following information:
Each page contains detailed information on a specific nutrition trait.
This report aims to provide information on the genetic risk of various health conditions so that the risk can be modified through lifestyle changes and preventive tests.
The following topics are covered in the report:
Aging Health: Tips to age better with information on progressive eyesight loss, hearing loss, sun damage, and how your diet can help fight harmful chemicals in the environment and food.
Bone Health: Gives a genetic perspective to injury risks
Joint Health: Information on how your daily activities along with your genetic makeup can put you at risk for still and sore joints.
Metabolic Health: Information on how your genetic makeup influences fat transport and usage
Vitamins and Minerals: Reveals how your genes respond to various vitamins and minerals in your diet
Muscular Health: Gives a genetic perspective on physical fitness
Sensitivities: Gives insights into your genetic risk for food sensitivities
Sleep Health: Information on how your genes influence sleep quality and requirement
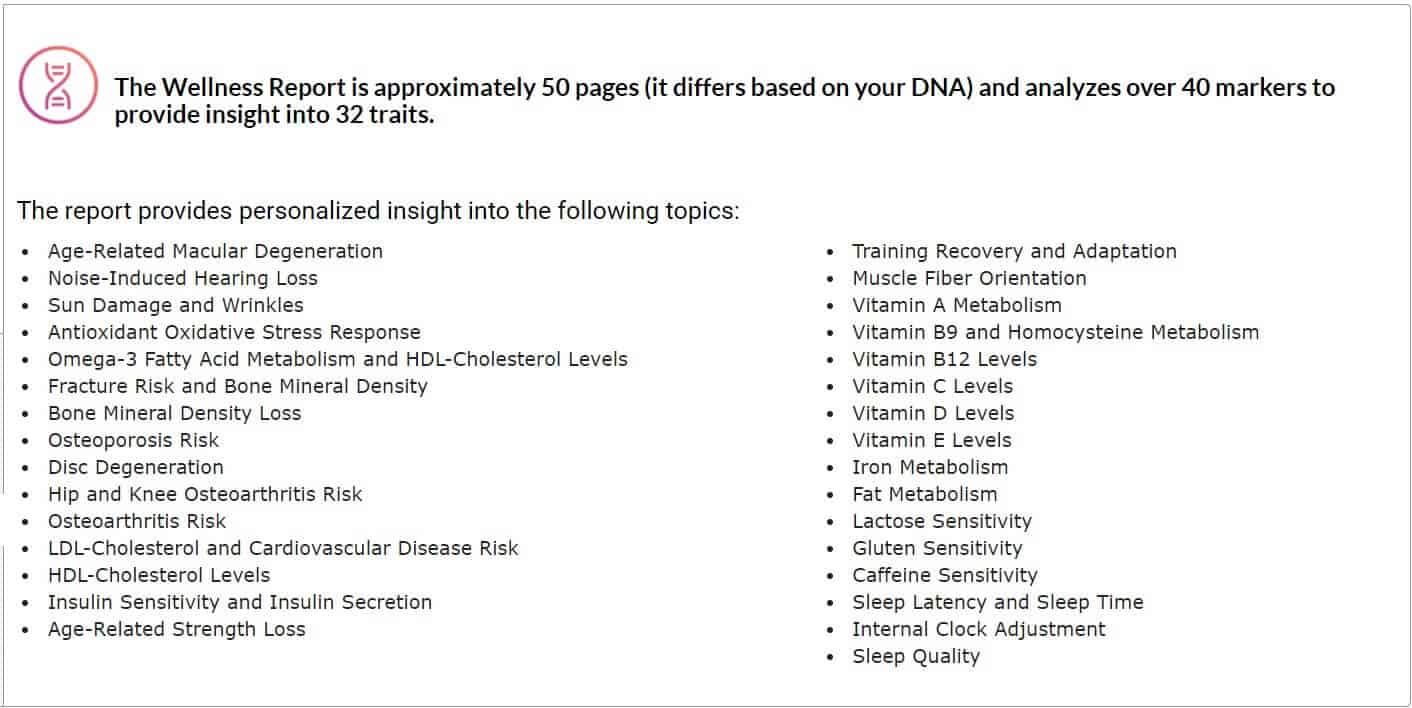
Image: All traits in the wellness report
Walkthrough of the Report
The report begins with the summary of your results tabulated under the section called "Overview of Your Report." It summarizes your outcomes for all the vitamins.
The table has the following information:
Each page contains detailed information on a specific nutrition trait.
Other than the three primary reports, they also offer
The Welcome Report serves as a preview of Atheltigen's products and services. It provides users a broad overview of what Athletigen's apps can do for you. The report analyzes over 40 genetic markers and includes 19 traits.
Walkthrough of the Report
The report starts with an introduction section which has a couple of basic genetic definitions and concepts jotted down.
It is followed by a how to read your report section.
It includes the information on one trait from each report category:
This report gives information about how certain genetic changes that are passed across generations affect nutritional profiles. It's been divided into three sections - Fuel, Perform and Restore.
Walkthrough of the Report
The fuel section includes information on vitamin B12 and vitamin D levels.
The perform section examines your response to endurance training and your risk for ligament injury.
The restore section gives your insights into your post-exercise recovery time and sleep performance.
You can avail Athletigen's report in 2 ways:
There is an option to upload DNA raw data from 23andMe or AncestryDNA and pay only for DNA analysis.
The DNA kit consists of a cheek swab which is used to collect a DNA sample. You can collect the sample and ship it to a US-based lab. Results take 6-8 weeks to arrive after the swab is received at the lab.
Update
The "Get DNA kit" link on the website is non-functional as of May 26, 2023. So, they may have stopped shipping DNA kits.
This is in affiliation with sequencing.com
The Athletigen privacy policy seems to be a little bit on the weaker side. The website mentions that "self-reported information, including ethnicity, family history, medical conditions, etc., are accessible to third parties."
Every user has access to their DNA raw data and can request to delete the information from Athletigen's database at any time.
Upon a written request from the user, Athletigen will close your account and delete your genetic information.
Customer Reviews in DNAtestingchoice: 3.5/5
Pros
Cons